Explore
In the exploration page you can explore available data by selecting data sources, viruses or hosts. When narrowing your exploration, a key notion to understand is What is a relevant host/virus/data source. Use the advanced options tabs to adjust filtering criteria, rendering options and to apply analysis tools.
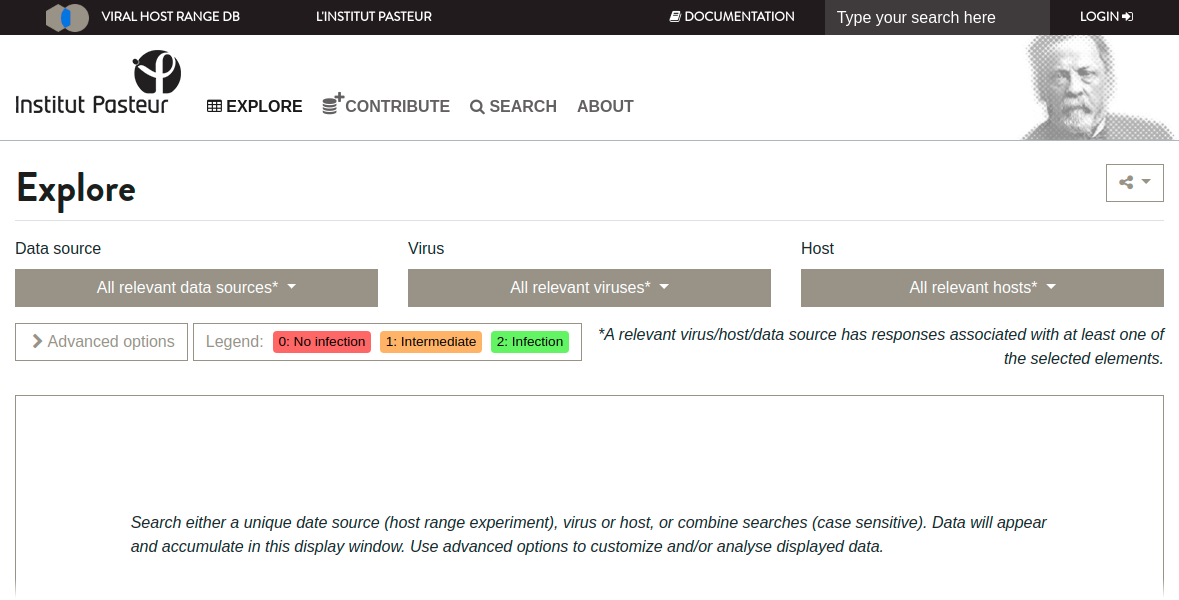
Main interface to explore the responses
Selecting and comparing data sources, viruses and hosts
The Explore interface has 3 main tabs : “Data source”, “Virus” and “Host”. Users can click on any of these tabs in order to browse the content of each section. A search interface is integrated in each tab for quick browsing. To visualize data, users must click on the element they want to visualize (this element can be a data source, a virus or a host). Users can then click to add additional elements to visualize simultaneously, or click on already selected elements to remove them from the current visualization. This way, it is possible to compare multiple data sources or restrict your visualization to specific hosts or viruses.
By default, when selecting one element, all data relevant to this element will be visualized (see section What is a relevant host/virus/data source). When clicking on a tab of the “relevant elements” (e.g. “Virus” if an “Host” was selected), only the list of relevant elements will appear. They will appear unselected even though they are printed on screen. This is to allow users to click on them in order to restrict the visualization to these elements. Conversely, if users want remove a few relevant elements from the current view, they can either :
click on “All”, and then de-select each unwanted element.
click on them (i.e select unwanted element), and then click “Inverse” to invert the selection, therefore selecting all the elements but these. Note that this approach is the less CPU consuming way to do it.
What is a relevant host/virus/data source
A host/virus/data source is relevant if it has at least one response associated with at least one of the selected elements. If you selected a data source, the relevant viruses and hosts are only those present in this data source. If you select a virus, a relevant host is a host that has this host has been tested for the selected virus in at least one of the public data source available in the VHRdb. Any data source where this response can be found is also relevant.
Example
data source
datasource_1documents the response of hostE. colito virusT4and virusT7data source
datasource_2documents the response of hostE. colito virusP1.
Element(s) selected |
Element(s) relevant |
|---|---|
|
|
|
|
|
|
|
none |
Advanced options
There are three sets of advanced options: Analysis Tools, Data filtering and Rendering.
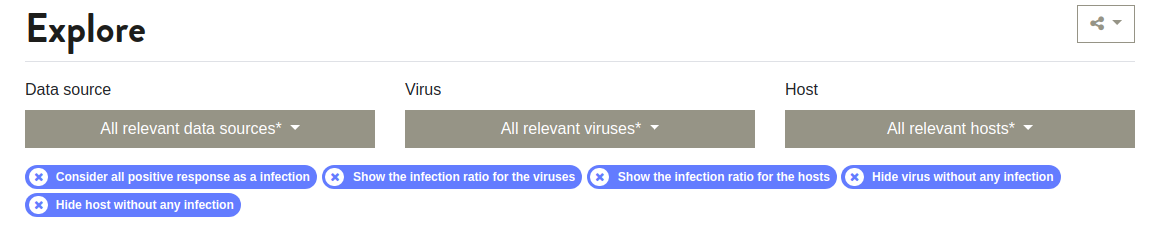
All selected options are stack-up under the selection area, as shown below, allowing users to easily remove them. These options will also be displayed when sending the web page using link sharing.
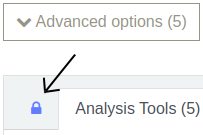
Quick tip
To keep the Advanced options panel opened, just click on the lock.
Analysis Tools
- Consider all positive responses as an infectionUsers can choose how “intermediate” responses should be considered for binary analysis. If this option is selected, “intermediate” responses (value = “1”) will be considered as an infection (value = “2”). By default, “intermediate” responses are considered as “no infection” (value = “0”). This is taken into account for the calculations in other options such as “show the infection ratio”.
- Consider that there is an infection only when all data sources documenting the interaction observed an infectionDifferent data sources can disagree on whether a given virus can infect or not a given host. Users can choose to display only congruent responses across all selected data sources, i.e. only when they all agree on it. Selecting this option will affect the calculations in other options such as “show the infection ratio”.
Data filtering
These options allows you to narrow the data displayed to published data (Only published data), or viruses with NCBI identifiers (Only identified viruses), or hosts with NCBI identifiers (Only identified hosts). Users can also restrict data to only one life domain.
Rendering
- Display the full table, even if it does not fit on the screenSelecting this option allows the entire set of data to be displayed without the need to use scrollbars. This option can be useful to create screenshots.
- Write hosts horizontallyIn columns header write the hosts and their identifier horizontally instead of vertically by default.
- Render table focusing on disagreementsWhen two data sources disagree (have conflicting values) on the response associated to a pair of host and virus, the cell is bordered in black with the default rendering. You can increase this highlighting by selecting this option which will fade other agreeing cells (see example below focusing on disagreements).
Default visual rendering
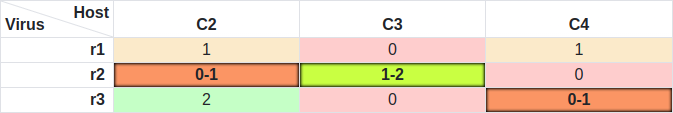
Visual rendering focusing on disagreements
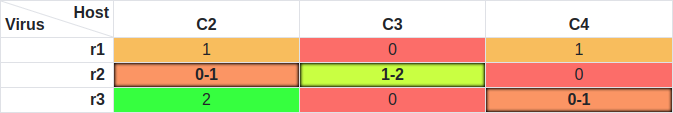
- Display the actual average response computedBy default, when two or more data sources have different responses for a given pair of exact same host and virus, the value “1-2” is indicated when the value of the average response computed is between 1 and 2, or “0-1” if the value of the average response computed is between 0 and 1. When selecting this option, the actual computed average will be displayed (e.g. “1.5” instead of “1-2” if one datasource has response “1” and another response “2”).Note that the background colour of each cell is always correlated to the actual average computed value, even if you select this option.